

Hot Streaks!

I was thinking about the “hot hand” idea in sports — this comes up often when watching, say, a basketball broadcast. Some player will hit 3 3-pointers in a row and you’ll hear that the player is on a HOT STREAK, and they should get the ball next time down the court presumably because the chance of hitting another shot is enhanced by the streak. And similarly for a cold streak — if someone misses 4 shots in a row, for heaven’s sake don’t let them shoot again soon since they’re COLD and will no doubt miss the next one too. This has been extensively studied, with many results seeming to show that there really is no such thing as the "hot hand", though some papers claim to show a small effect.
It’s sort of interesting, by the way, that this is a little bit contrasted by the pervasive feeling that if you’re flipping a coin and get 4 heads in a row then you might think a tails flip is pretty likely because it’s somehow “due”.
Looking at real data, check out the stats for Klay Thompson:
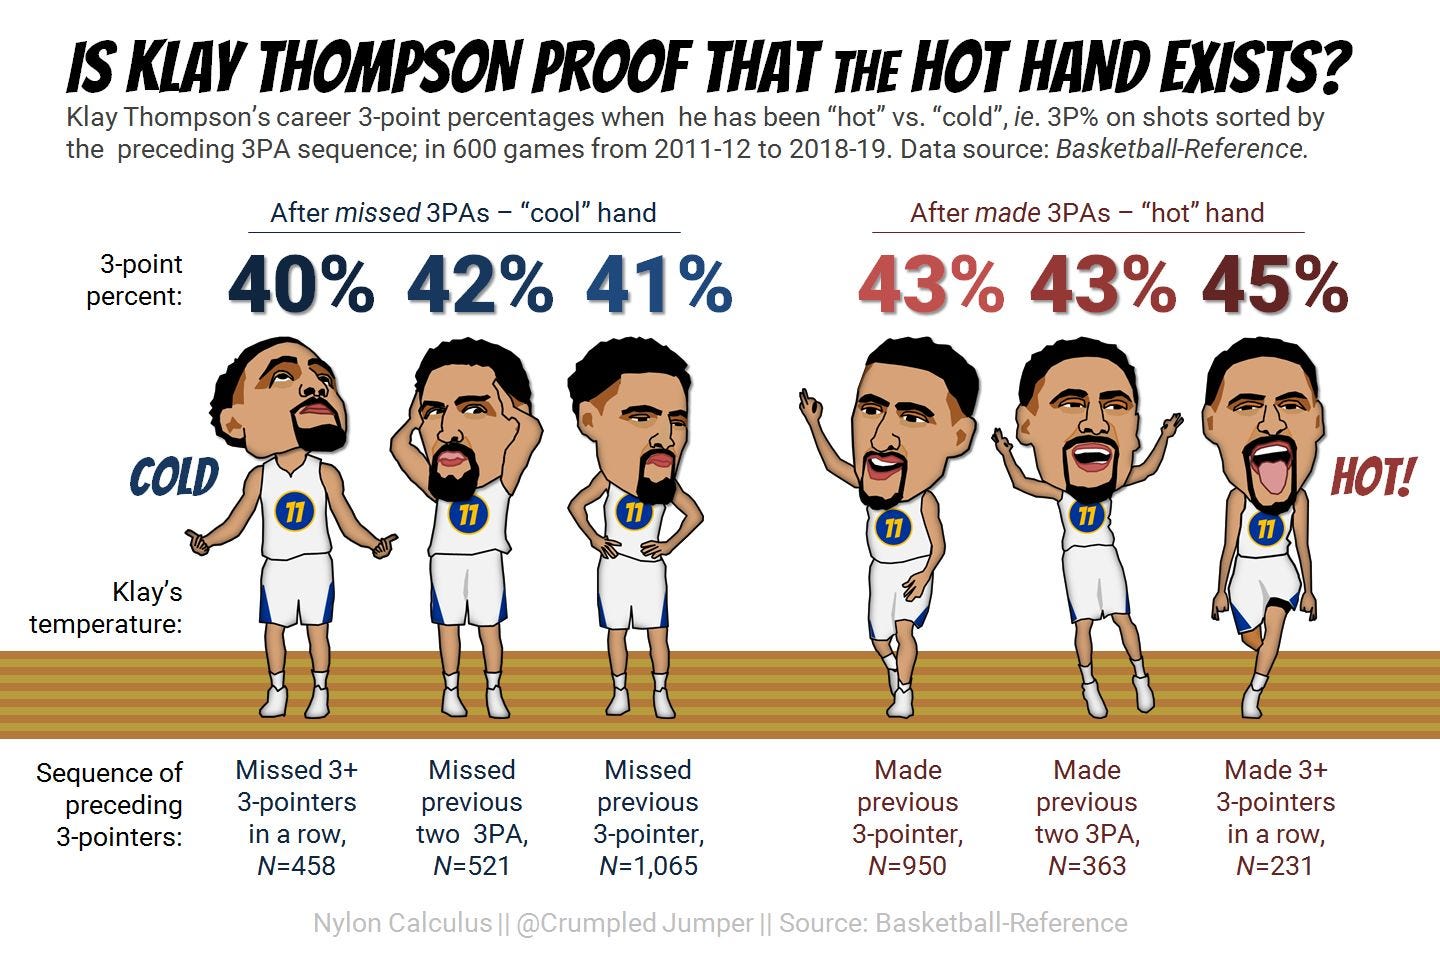
This looks like a bit of evidence for the hot-hand, since it looks like he makes 45% of his shots after 3 straight successes and only 40% after 3 straight misses. But what we’d like to know is if this works for everyone, or just him — here are the stats for other shooters:
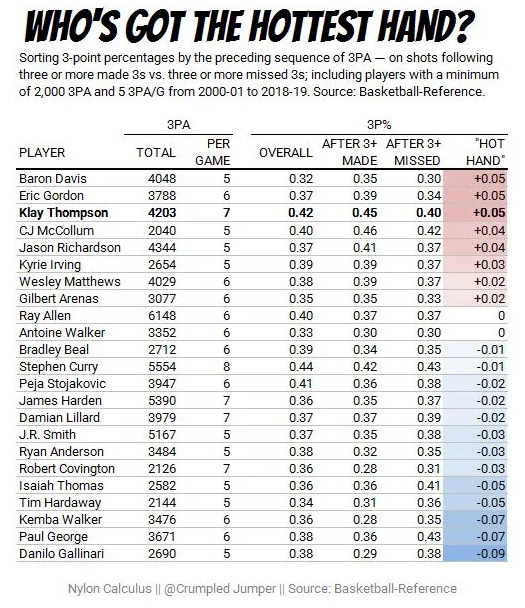
So the effect seems to be swamped out by looking at lots of different people, where the majority of them are actually a bit worse after making 3 in a row.
Anyway, I wasn’t taking this head-on, but rather thinking about an associated issue — those players who are thought to be “streaky” shooters.
So I was playing around with some code in Python and ran some sample streak chances, and it's remarkable how fast the probability of a certain streak rises with even a moderate increase in shooting percentage per try. Here, for example, is a toy model of a basketball player who takes 200 3-point shots (maybe a typical month for a modern high-volume shooter). Suppose we're interested in the chances that, at some point, the player has a "hot streak" of 6 makes in a row --- something that makes the local news and fans are bound to remember for some time.

If the player is a 30% shooter, there is only a 10% chance of such a streak occurring. But the chances double for an (NBA-average) 35% shooter, and for an outstandingly good shooter (45% is the highest career 3-point percentage) we'd expect such a streak more often than not in every sample of 200 shots. I was a bit surprised that the relationship is so non-linear! A 50% increase in skill (30% to 45%) results in 6 times the number of streaks! So I suspect these relatively small differences in skill are responsible for attributes of a so-called "streaky" shooter (which are almost never borne out by the statistics). I chose a 6-shot streak arbitrarily, here is the likelihood for a 4-shot streak over the course of 50 attempts (a few games, so that this might happen many times during the season, reinforcing the notion of "streaky"):
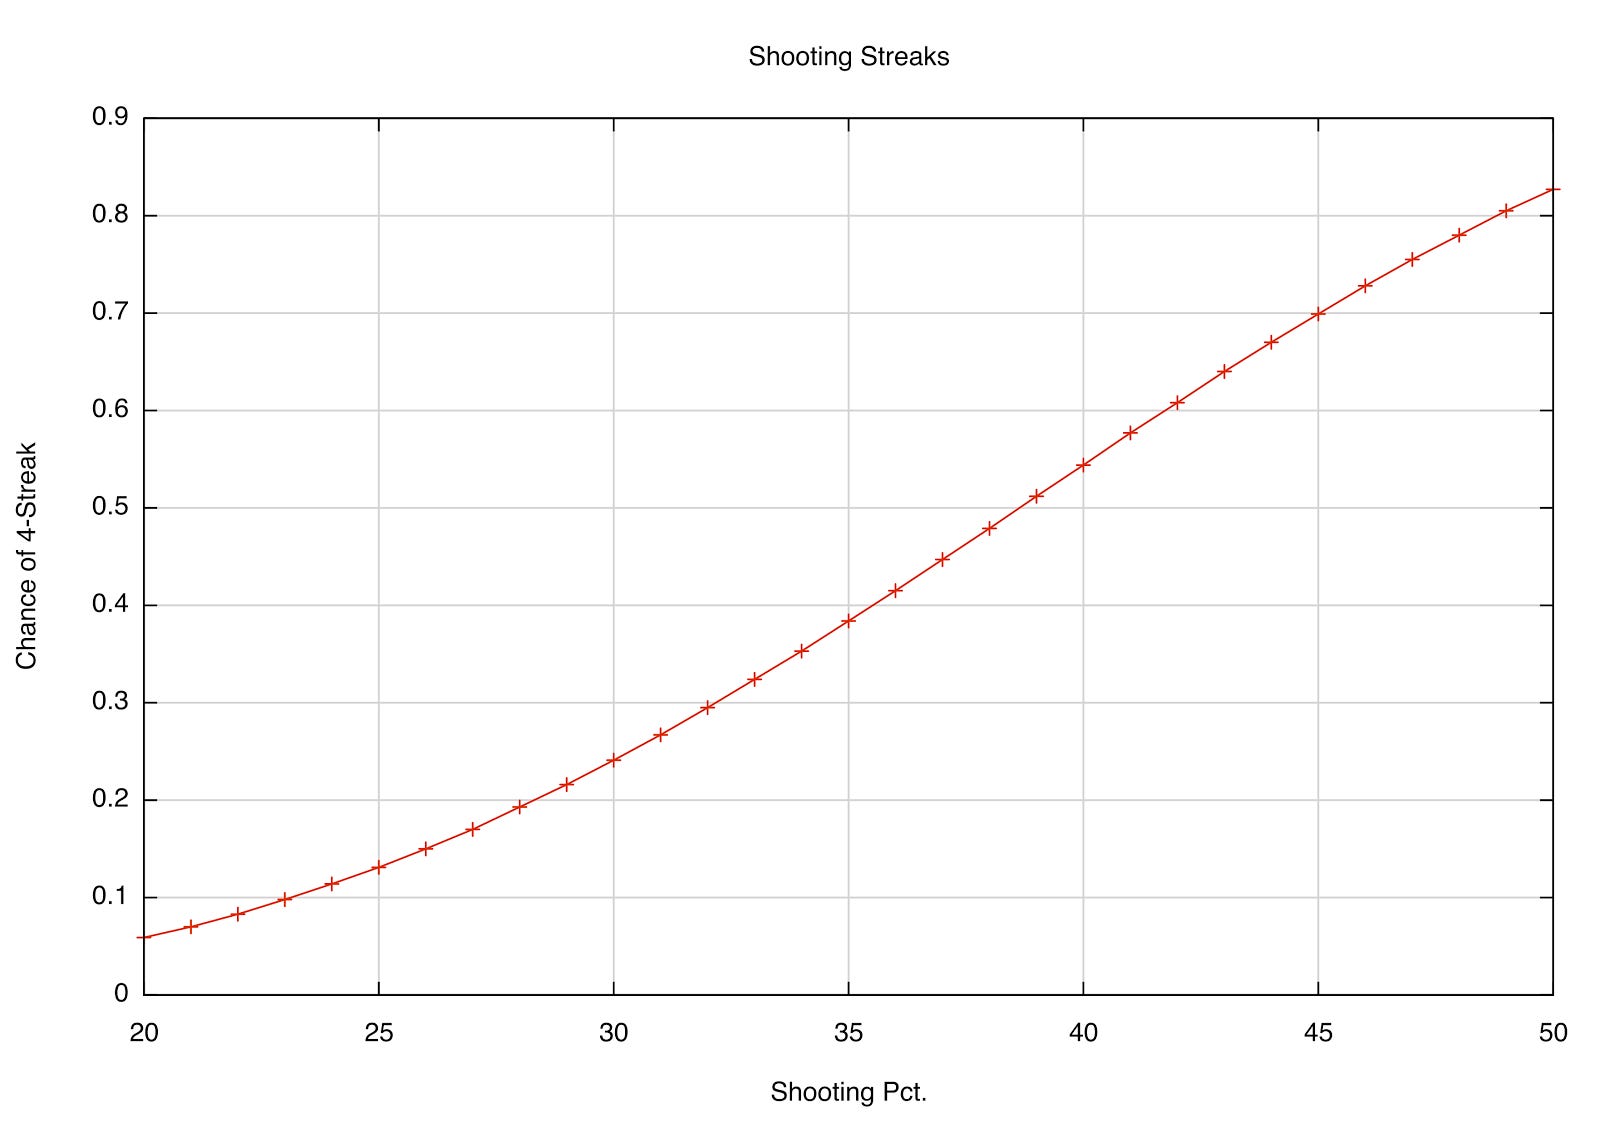
Chance of having a 4-make streak out of 50 chances as a function of shooting percentage
Here, you can see that for an average shooter (35%) you might expect a "hot streak" 40% of the time over a sample of 50 attempts, but again this doubles for great shooters.
On Deck:
The next article I’m working on:

The metric tensor! Fundamental to Einstein’s theory of gravity (General Relativity), I’m going to explore where it comes from, why we need it, what it is, and how we use it. Sa-weet.

If you’re a student/teacher and want to see lots of worked examples that I like to include in my classes when I teach the “standard” University Physics 1 and 2 courses, feel free to browse the (growing) collection of 150+ videos at
And if something is especially cool and you’re inclined to leave a “tip” I’m not above coffee or pizza:
Thanks for reading First Excited State! Subscribe for free to receive new posts automatically!
Great topic!