Here’s the pretty simple and hopefully convincing case that humans are responsible for the recent warming of the Earth. I’ll identify 4 steps in the chain of reasoning:
the CO2 levels in the atmosphere are rising
the excess CO2 comes from human activity
CO2 causes warming
the Earth is warming at the corresponding rate
And that’s pretty much the case. I’m not advocating here for any particular policy or remedy, only to try to forge some kind of general agreement on what physically is happening and why — in my view, that’s the necessary first step.
The CO2 Levels in the Atmosphere are Rising
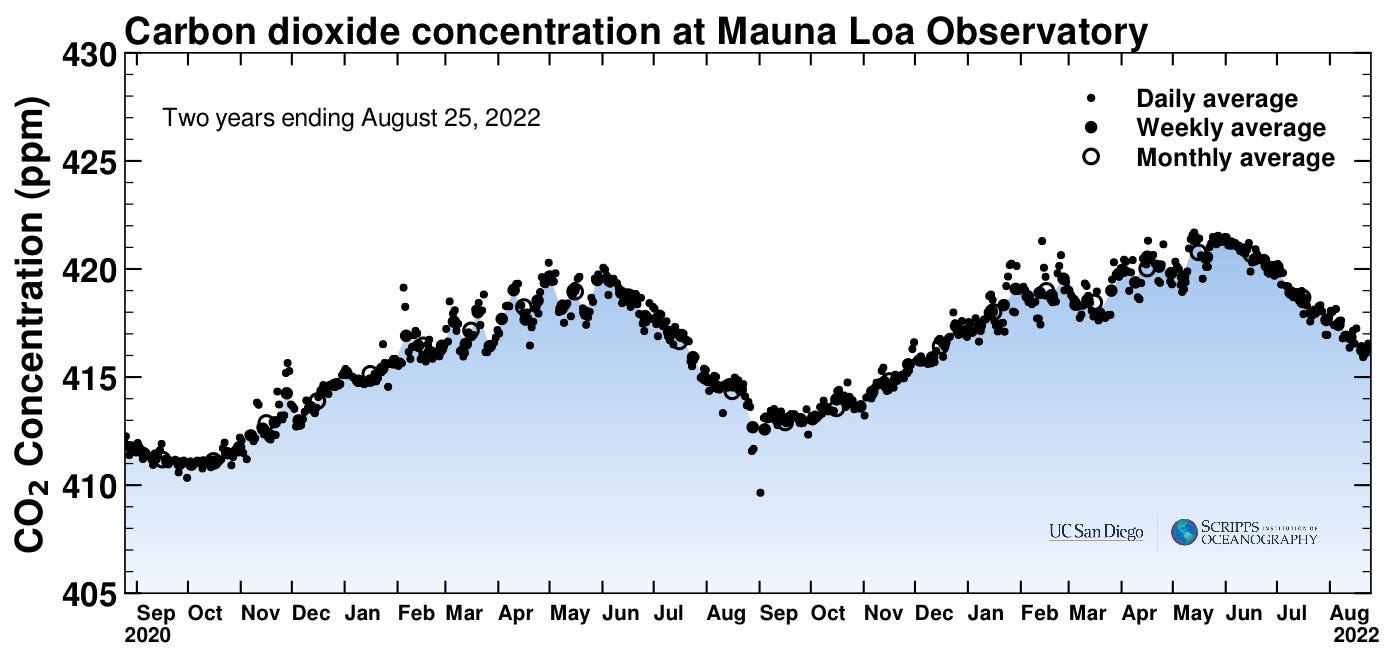
I’m not sure if there’s really any dispute about this, but let’s establish it anyway. You can keep track of the latest numbers and get some historical data here: CO2 Earth. There are data plots (some shown below) at The Keeling Curve, and a long-running data set has been continually observed at the top of Mauna Loa in Hawaii. Here’s what it looks like the last couple of years:
It’s pretty interesting that it doesn’t stay constant. It apparently increases over the winter months and decreases during the summer, similar to a plot of my weight, albeit with different units. What’s going on is sort of poetic — during the summer months, trees produce leaves that soak up CO2 from the atmosphere; after the growing season, when leaves fall and decay, CO2 is returned (this is in Northern Hemisphere seasonal reckoning, since there is more vegetation there).
The entire planet, in quite a literal sense, breathes. Inspiration in the spring, expiration in the winter.
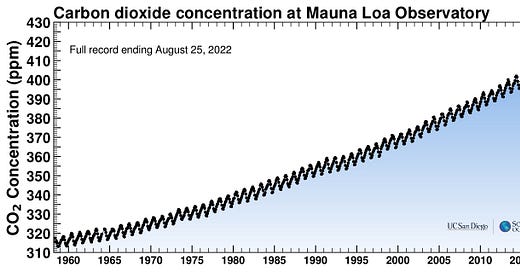
If you squint, you might be able to convince yourself that the peak in June 2022 is a bit higher than in June 2021. The real point, though, is inescapable when you see a longer run of data:
You still see the lovely pattern of planetary respiration during each year, but it’s now pretty obvious that the overall average concentration is increasing. And, once again, you might have to get the magnifying lens out to see that the increase is itself increasing each year — ever raising the stakes in a hubristic dare against Nature.
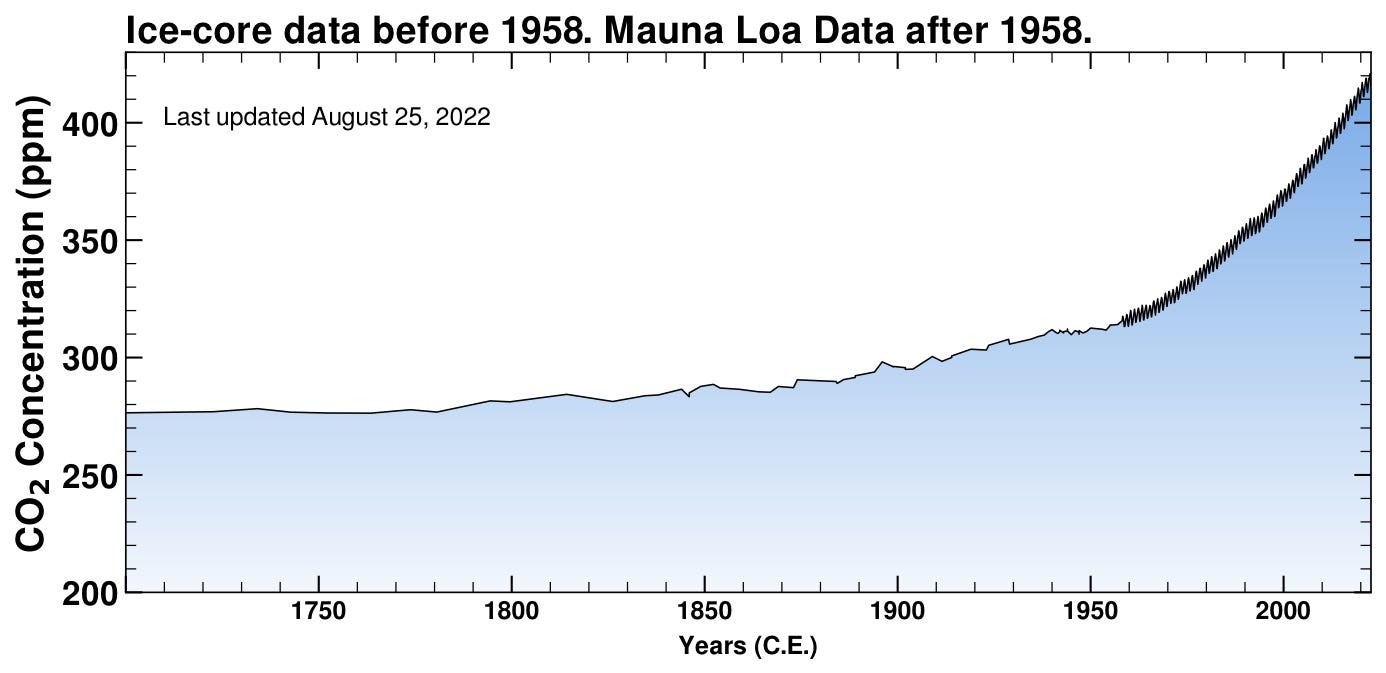
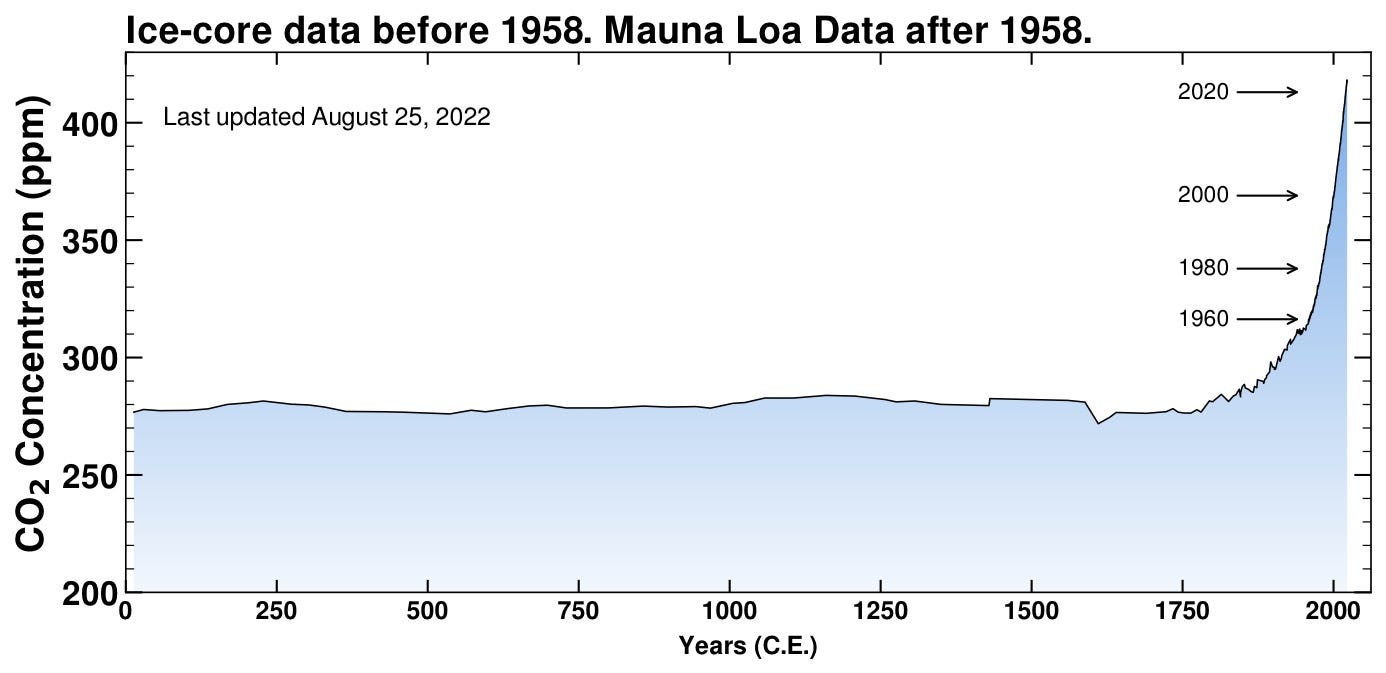
Ok, whatever — we’ve been assured that the CO2 level has been higher in the past, so what’s the big deal? Our continuous, direct measurements date back to 1958, so how do we know what was going on before then? We can actually, literally, sample historical atmospheres! Old air samples are conveniently stored for us, entombed as bubbles in frozen ice cores. As years upon years of snow fall in Arctic and Antarctic regions, accumulating pressure traps bits of atmosphere in the thickening ice. So here’s what the CO2 concentration was like the previous 250 years (well before industrialization).
So there’s been no recent comparable rise; in fact, the level seems to have stayed pretty steady before about 1850 (it was only a bit after this time when coal overtook wood as the dominant fuel source for industrialization). Why was the switch to coal important? Because burning wood liberates carbon that was recently stored during a tree’s lifetime, so it’s still part of the rough equilibrium of the carbon cycle — the sequence of processes that store and release existing carbon in the atmosphere and surface. Burning coal, though, injects into the atmosphere a new source of carbon that had been sequestered for millions of years. This “new” reservoir of carbon is now added to the cycle bit by bit over the years.
But how stable was this equilibrium? Maybe things changed on longer timescales. Ok, we can look farther back — here’s the data for the last 2000 years.
That natural carbon cycle seems to have kept things pretty rock-solid between 250-300 parts per million for at least the last couple thousand years. How far back can we go?
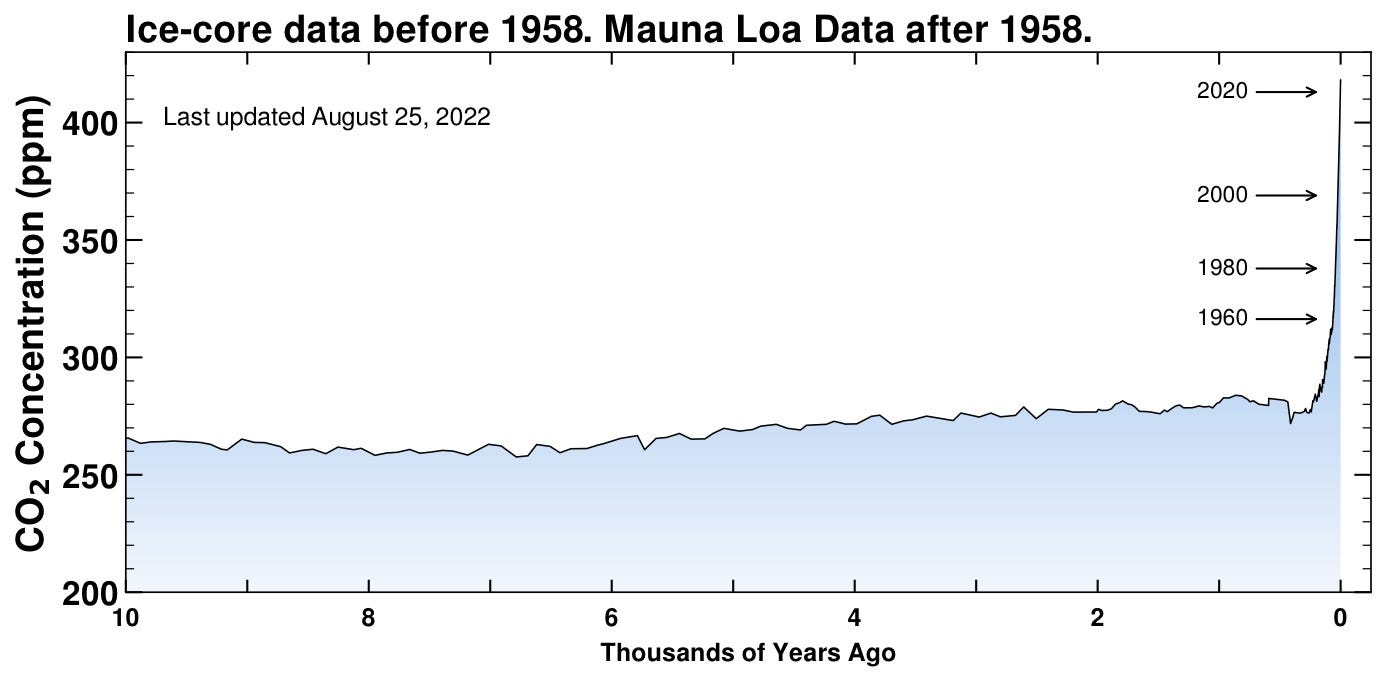
Farther.
Now 10,000 years! Still hovering between 250-300 ppm. You can see in this longer historical context how rapid the new injection of carbon is in modern times. Look at the sudden spike! Nothing like that has happened in human history, at least as far back as we’ve had cities and agriculture.
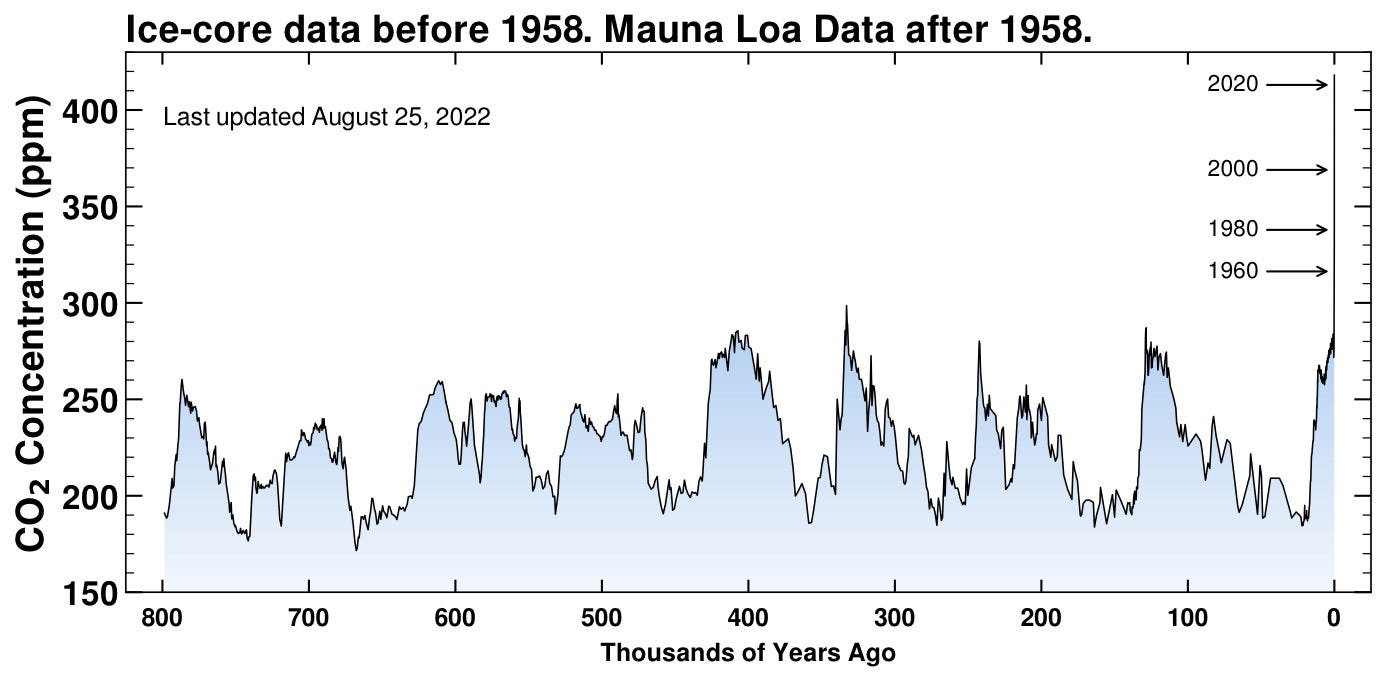
Let’s go back farther! We start to reach a practical limit somewhere around a million years ago since ice sheets aren’t infinitely thick and grow slowly. Now we’re getting somewhere. On really long timescales (compared to human activity) we start to see some cyclic action. Some of the rise and fall we can attribute to slowly-varying wobbles in Earth’s orbit around the Sun as well as changing volcanic patterns (large volcanic events can act as a source of CO2). Even so, a couple things to notice:
The concentration still stayed between about 200-300 ppm, illustrating the robust nature of Earth’s compensatory thermostats.
Even the “quick” rises took thousands of years. Our sudden transfer of carbon from underground to the atmosphere in about 100 years has no historical parallel.
The Excess CO2 Comes from Human Activity
The simplest way to see this is just to count it! Fossil-fuel burning currently emits about 36 billion tons of CO2 per year — here it is historically:
Notice just by eye how well the shape of that curve matches the observed CO2 increase. But let’s just see if those levels of emissions even roughly correspond to the observed increase of about 100 ppm in 60 years.
Ok, you might have noticed that there are two different units used for measuring CO2: parts-per-million (ppm) and mass (Gt, or Giga-tons, or trillion kg). To compare what we know we’ve emitted with the increase in concentration, we need to convert between those 2 things.
What’s the strategy? We need to find out how many molecules are in the atmosphere in the first place (roughly!), and then find out the mass of a millionth of those if they’re CO2.
First step! What’s the mass of the whole atmosphere? How can we possibly know this? Here’s a simple way that is fairly accurate: we can measure the atmospheric pressure, which is expressed as some sort of weight of the atmosphere over each square meter, and then multiply by the surface area of the Earth! Atmospheric pressure is about
and the surface area of the Earth is
so then the mass of the atmosphere is
Then to get the number of molecules, we use the cool trick you might remember from a chemistry course — the molar mass of a molecule tells you the mass of a mole of those things. But the atmosphere is made up of different things, so we have to be a little careful. Really, it’s almost entirely nitrogen and oxygen molecules (N2 and O2), which have molar masses of 28 g/mole and 32 g/mole respectively. And the ratio of those is about 3:1, so on average, most of the atmosphere can be modeled as a gas with a molar mass of 29 g/mole. So then
Almost there! Out of every million moles of atmosphere, one of them will be CO2, so now just multiply by the molar mass of CO2, and Bob’s your uncle:
Looking at the charts above, the CO2 concentration has increased about 100 ppm in the last 60 years, so that means a net mass increase of 783 Gt. And also our average emission rate for the last 60 years is about 23 Gt/yr, or a total of almost 1400 Gt. It looks like we’ve emitted about twice as much as has accumulated in the atmosphere, but hold on… not all of what we emit just stays there. The oceans and plants absorb some of it. How much?
The fraction of emitted CO2 that ends up being absorbed (taken out of the atmosphere) is about 50% of what’s emitted — half to the oceans, half to plants on land (source) so we’ve pretty much nailed it.
So we can account for the increase in CO2 with human-generated emissions. The numbers work out, but there’s even more damning evidence just in case it seems like fortuitous accounting.
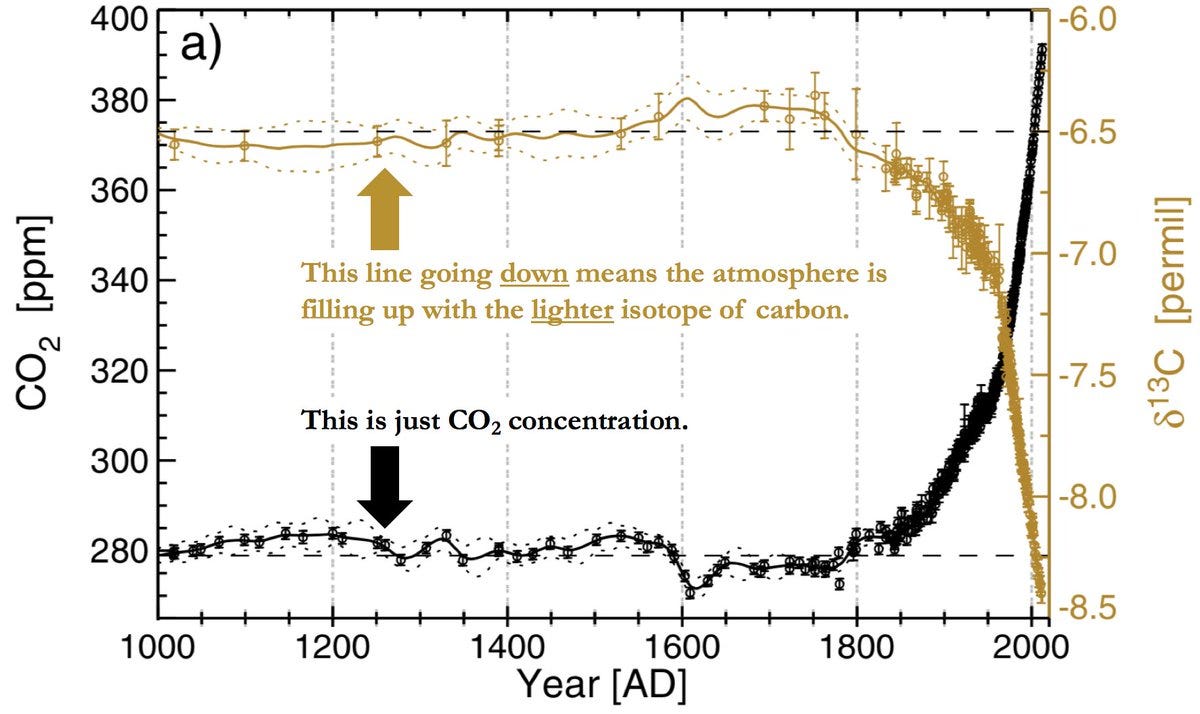
It turns out that there are two different kinds of naturally occurring stable carbon isotopes: carbon-12 and carbon-13. Carbon-13 is the rarer one, only accounting for about 1% of carbon atoms. It also turns out that plants (progenitors of fossil fuels) prefer carbon-12, being lighter and easier to diffuse in and out of cell membranes, among other things. So when we burn fuels, we release more carbon-12 relative to carbon-13, driving down the ratio of C-13/C-12. Well, take a look at this:
The CO2 increase is precisely timed to the decrease of that isotopic ratio. Wow.
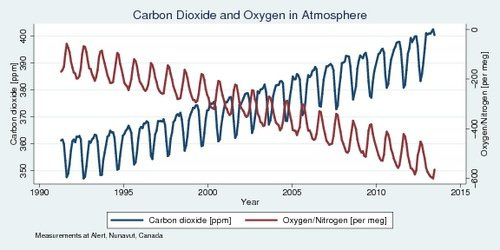
And just in case you need something else, how about this: when fuels are burned, the carbon combines with oxygen in the atmosphere to make CO2. So you’d figure that we should see some decrease in the oxygen level of the atmosphere since we’re taking free O2 and hooking it up with a carbon atom. We see that too!
It’s really beyond dispute that the rise in CO2 is due to human activity — burning fossil fuels long buried under the surface.
CO2 Causes Warming
In a previous article I noted how a simple absorbing layer in the atmosphere can drive up the temperature of the lower atmosphere since it radiates (in part) back down to the surface. Here’s a little more detail on how that works, and why CO2 is a key player.

The orange-shaded curve at the top represents the incoming radiation from the Sun — most of that gets through to the surface. The curves on the right represent the outgoing radiation from the warmed Earth’s surface. Now, if all that infrared light escaped to space (more dark blue under the curves), we said the Earth would have an average temperature of right around 1ºF, well below freezing! You can see that water vapor is the dominant absorber for outgoing radiation, but look at the CO2 absorption — at wavelengths of about 4 and (especially) 15 microns it sort of “fills in the holes” where water vapor is transparent. It’s this little bit extra absorption (just a little thicker blanket) that is slowly warming the planet. At least, it should be slowly warming the planet. So is the planet actually warming, and can we account for the rate?
The Earth is Warming at the Corresponding Rate
What have we established so far? CO2 levels are rising, we’re responsible for it, and the action of more CO2 should be to warm the planet. What do we see?
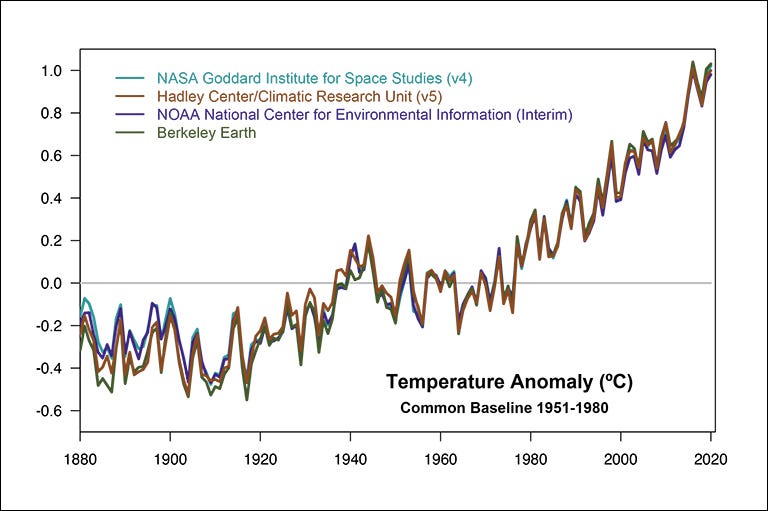
Since the beginning of the 20th century, the Earth has apparently warmed by about 1.5ºC according to many different national and international measuring teams. How does this compare to what we expect? Recent calculations warn us that doubling the CO2 concentration raises the global temperature by about 3ºC; we’re about halfway to doubling it (a rise from 275 ppm to 420 ppm) and we see half of that expected rise! That’s good confirmation of the basic physics, since there’s good reason to expect that the response is approximately linear at these concentrations.
But what if someone says, “maybe it’s the Sun!” It certainly seems reasonable that if we were receiving more radiation from the Sun, then we’d warm up. How can we rule that out? Because we have satellites that constantly measure the solar output, and it doesn’t change anywhere near enough to cause the observed warming. Not only that, but during the last 40 years of constant warming, the Sun’s output actually decreased slightly.
And even more, it was mentioned in the previous article that a hallmark of a greenhouse effect is that the total amount radiated back into space stays the same (as it should, since we get the same amount from the Sun), but since the lower layers of the atmosphere are warming, then the upper layers must be cooling (which we do, in fact, observe).
Case closed! There really isn’t any serious dispute any more whether humans are causing the present warming trend by burning fossil fuels. We are.
On Deck:
The next article I’m working on concerns one of the most important numbers in astrophysics — the maximum mass of a white dwarf (and a little bit about the physics of these crazy interesting objects and their “degenerate” phase of matter).
If you’re a student/teacher and want to see lots of worked examples that I like to include in my classes when I teach the “standard” University Physics 1 and 2 courses, feel free to browse the (growing) collection of 150+ videos at
And if something is especially cool and you’re inclined to leave a “tip” I’m not above coffee or pizza:
Thanks for reading First Excited State! Subscribe for free to receive new posts automatically!








I love this. I work with the UN on climate change and I’d love to see them explain things so clearly ...
just gonna put a link to this on page 1 of my dissertation and call it good